This blog was first published on medium.com and Analytics Vidhya News Bytes
This blog examines the Analytical Database of Individual Multinational Enterprises (MNEs) and their Affiliates (ADIMA) dataset from OECD to understand the structure and presence of the top 100 MNEs of our time across the world.
Background
Visibility of information on Multinational Enterprises (MNEs) has been limited at best despite their significant and growing importance in our daily lives as well as public policy area. By nature, MNEs are large and complex with a multitude of activities across a number of jurisdictions. Overtime, many also have built up a rather elaborate chains of affiliates, holding companies and special purpose entities, designed for various reasons including fiscal optimisation, making it particularly difficult to understand the structure and presence of MNEs global footprint.
To address these challenges, the OECD has begun to develop an Analytical Database of Individual MNEs and their Affiliates (ADIMA) since 2018, by compiling both publicly available statistics and using alternative micro-data to understand the scale and scope of the international activities of MNEs. This blog explores this dataset (the latest release in July 2019).
Specifically, we explore the data in-depth and look into the factors affecting MNEs’ decision on the extent of their worldwide presence. In economics, this is a subject under the research of industrial organisation.
Dataset
The latest release of ADIMA (July 2019) includes the top 100 of the largest MNEs (by sales), headquartered in 17 countries. Its purposes are three-fold:
- a Register of MNE affiliates and presence;
- a series of economic Indicators at both the level of the MNE and the individual countries in which it operates; and
- a monitoring tool that aims to provide a timely flow of information on MNEs restructuring to aid the work of national compilers.
ADIMA leverages publicly available data within a structured framework. It combines traditional data sources, such as annual company reports, with alternative microdata sources, such as Thomas Reuters PermID, the Legal Entity Identifier (LEI) and data contained within company websites and their URLs.
There are four sets of data included in ADIMA including: MNE digital and physical register information, MNE indicators and monitors which lay out financial information and news hits on Wikipedia respectively. The monitor dataset includes predictions on news hits to capture potential restructuring changes within MNEs that are not necessarily reflected through public announcement.
Questions to be addressed
Despite being a small dataset, ADIMA provides some insights into the top 100 MNEs. This blog addresses three questions based on the dataset prepared in the above-step.
- Which sectors and countries have the most MNEs?
- Does firm-level productivity per employee influence MNE’s internationalisation as suggested in economic literature(1)?
Sectors and Countries that have the most MNEs
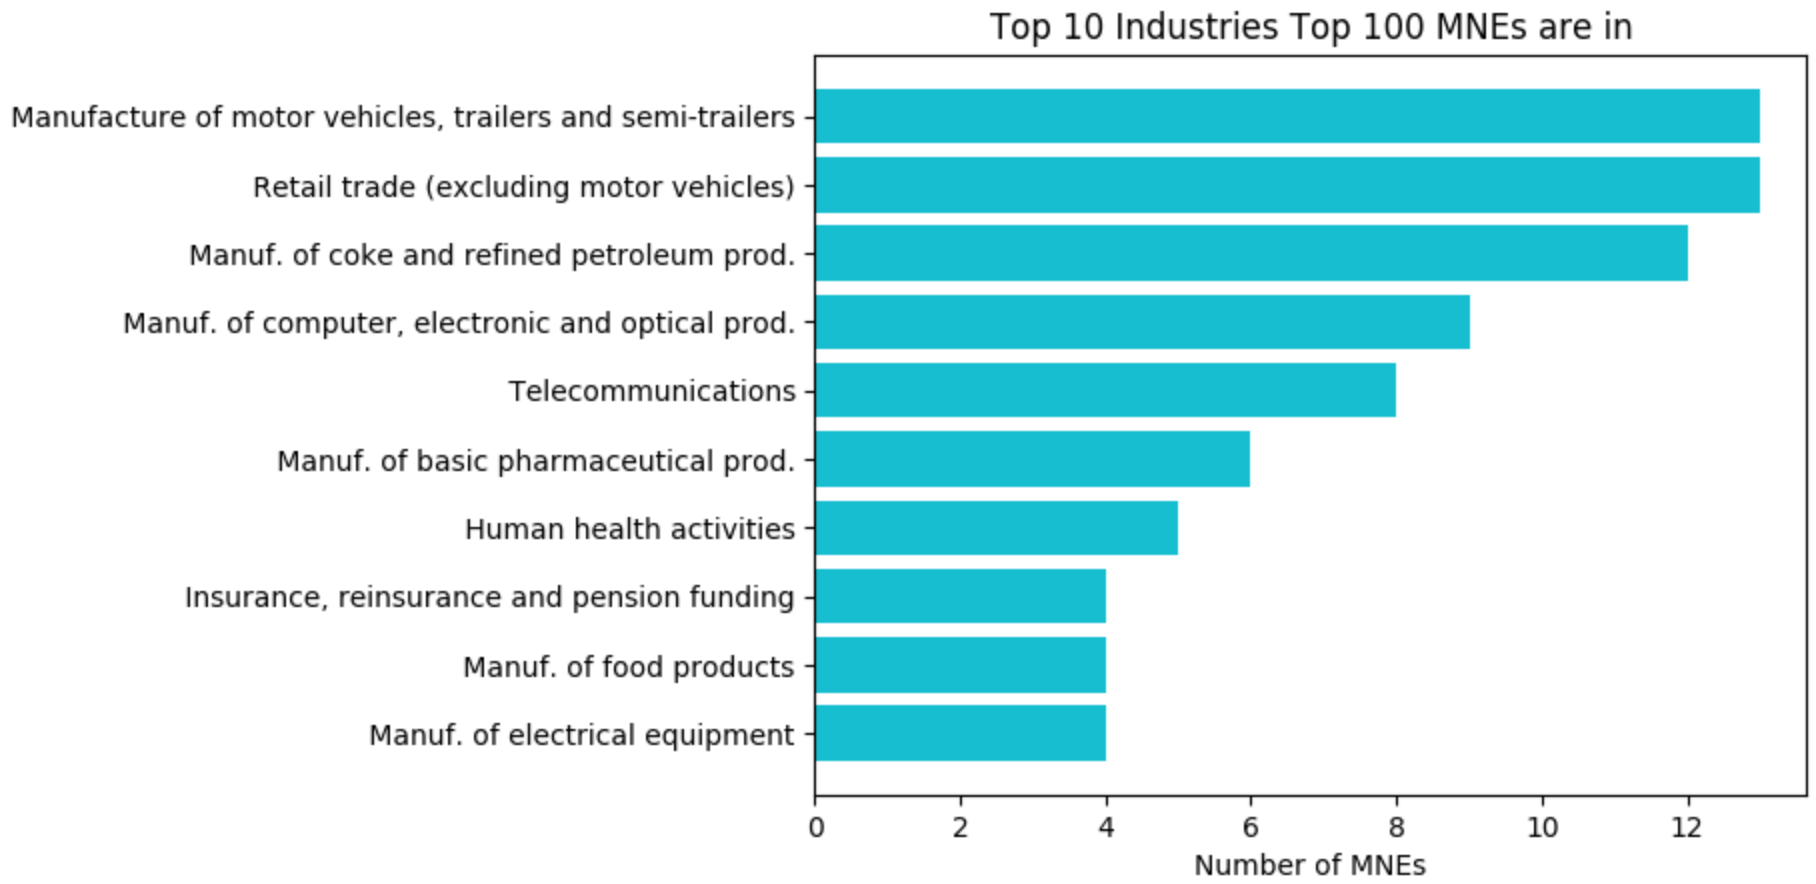
The chart below shows the top 10 sectors that have the most MNEs operate in are manufacturers of vehicles, petroleum and pharmaceuticals, retail trade and telecommunications.
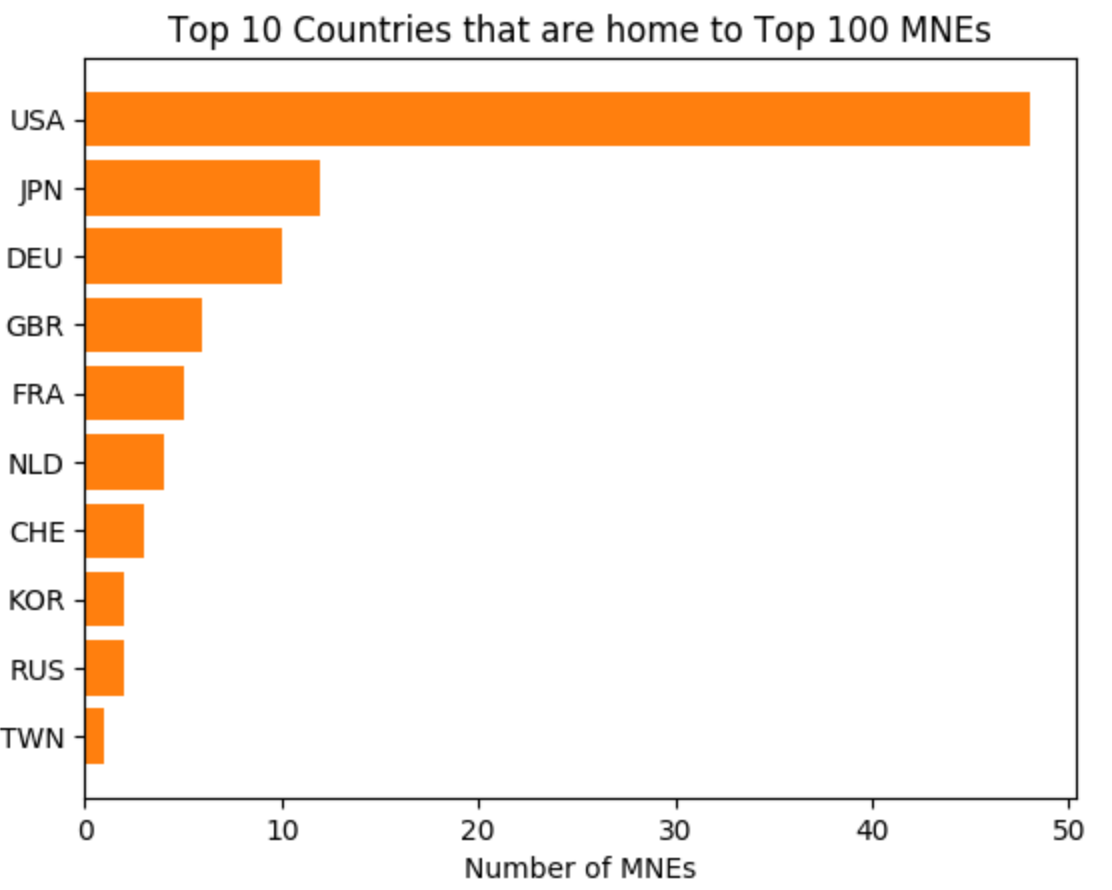
Countries that are home to the most MNEs are the USA with a leading place of hosting 48 companies, followed by Japan and Germany with 12 and 10 MNEs respectively.
Firm-level Productivity and International Dispersion
Economic literature held a long-established hypothesis that the most productive companies grow into multinationals through international expansion(1). The ADIMA database provides an opportunity to look at the relationship between firm-level productivity and the internationalisation of these MNEs. Two variables are constructed to measure firm level productivity (2) and MNE internationalisation (3).
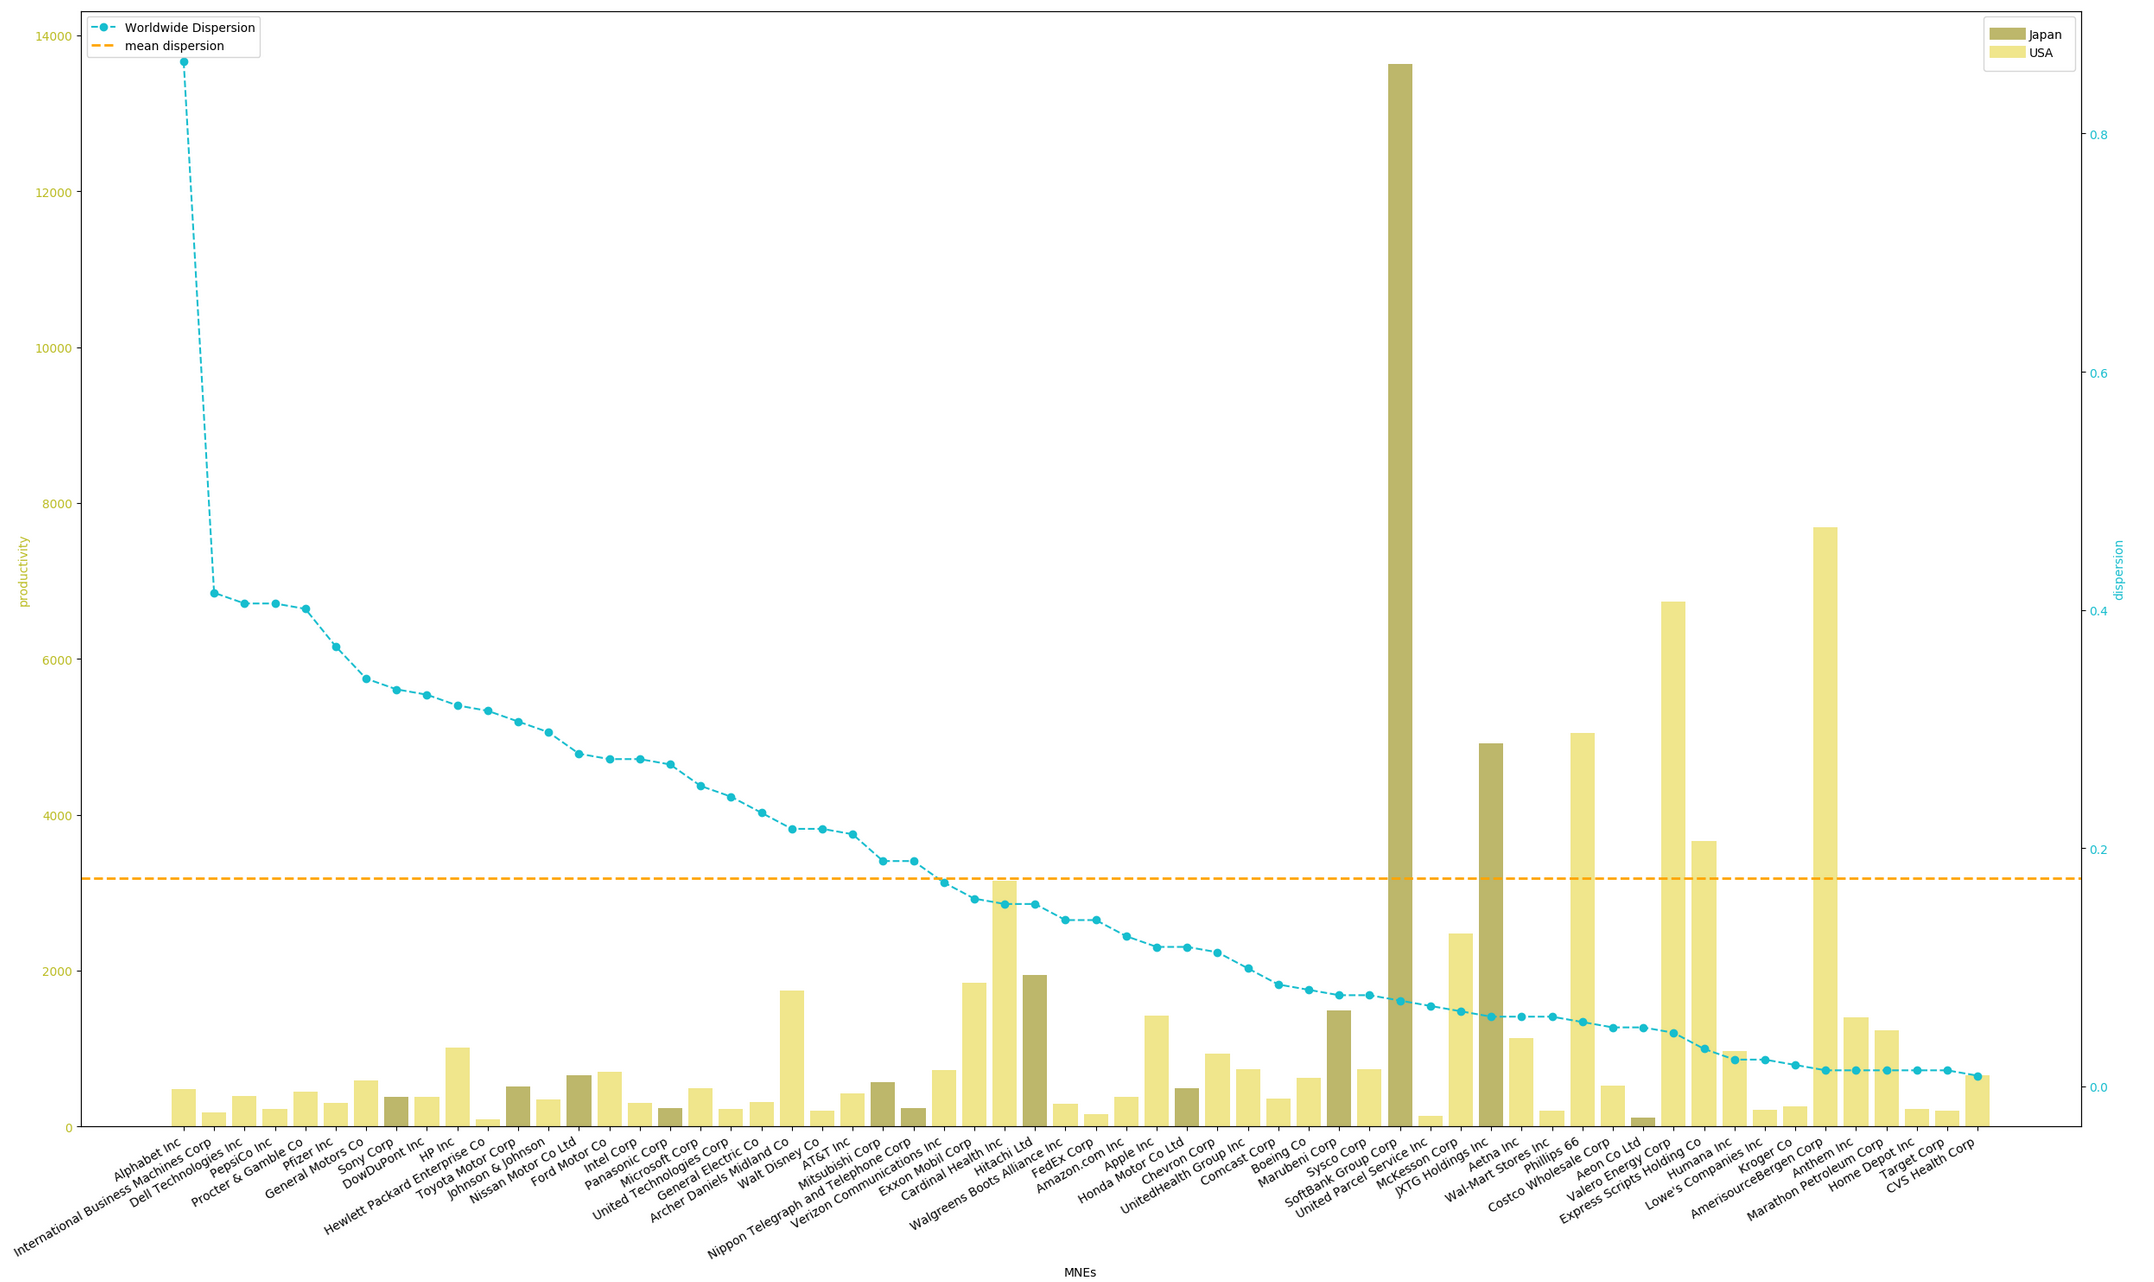
The chart above illustrates the mapping of the correlation between firm-level productivity of the US and Japanese MNEs and their international dispersion. At a glance, there does not seem to have any immediate correlation pattern. Interestingly, irrespective of whether the MNE is headquarter-ed in the US or Japan, lower productivity (defined by lower than the mean productivity of all MNEs in orange line) companies seem to have higher dispersion (in descending order). Meanwhile, highly productive MNEs seem to have lower international dispersion.
Caution here needs to be considered on sector difference, for example, intuitively, it may not be surprising to see Softbank, a Japanese telecommunication and investment firm, is the most productive firm after removing returns from net assets with a low international presence. This may because most of its business services can be carried out remotely.
Companies like Alphabet Inc. and Apple Inc. have extremely high productivity per employee before removing the effect from net assets but very higher international dispersion. Presumably this is because the large cash and cash equivalents (in net assets) was removed from the productivity calculation.
Alphabet, the parent company of Google has the highest international dispersion. This is because the emphasis of ADIMA is to seek out all global presences of each MNE by looking at not just their annual reports and physical registers, but also their digital presence, which is Google’s primary business operating model.
Conclusion
The ADIMA dataset is very small with only 100 MNEs and one year firm-level financial data. However, it provides a good start to peek into many aspects of these giant corporations. The OECD, tasked by G20, is one of the international organisations leading the way to provide public transparency to these companies.
From a data analysis perspective, other than limited data availability, there are also some other drawbacks in this analysis to improve further:
- More accurate construction of international dispersion and productivity;
- The discrepancy on feature selection may be due to the non-linearity and multicollinearity of data. Further feature and model selection is thus needed;
- Additional features such as company history, and public sentiment (or brand value) are also considered helpful in exploring the factors influence an MNE’s global presence.
Note: For detailed technical code, you can find it on Github here.
References:
(1) Helpman, E., Melitz, M. and Yeaple, S. (2004), “Export versus FDI,” American Economic Review 94, 300–316.
(2) The measure of productivity is known as Solow residual, which calculates the portion of an economy’s output growth that cannot be attributed to the accumulation of capital and labor. Due to limited data available the variable was constructed in a simplified fashion and should be treated for indication purpose only. Solow, Robert (1957). “Technical change and the aggregate production function”. Review of Economics and Statistics. 39 (3): 312–320
(3) Dispersion is measured by the number of countries an MNE has presence over the total number of countries.